


Short answer. Good AI agent metrics show an agent finishing the tasks it was given without a person redoing them, staying inside its permissions, and costing less per completed task than the old way. Track eight numbers: task completion rate, human correction rate, exception rate, escalation rate, failed actions, permission violations, cost per completed task and time to resolution. Review them weekly for the first 90 days, sampling real work, then move to monthly.
Sources verified 23 September 2026. The thresholds in this post are my starting points for investigation, not industry benchmarks.
Gartner predicted in June 2025 that more than 40% of agentic AI projects will be cancelled by the end of 2027. The reasons it gave were escalating costs, unclear business value and inadequate risk controls. All three show up in basic AI agent metrics months before anyone cancels anything.
Look at those three reasons as a business owner and they collapse into one. Nobody measured.
An AI agent, meaning software that takes actions through your systems rather than only answering questions, is harder to judge than a chatbot. A chatbot gives an answer you can read. An agent books the appointment, updates the job in your field service software, drafts and sends the follow-up, and moves on. If nobody counts what it did, how often a person fixed it behind the scenes and what each finished task cost, you find out it wasn’t working when a customer tells you.
The eight metrics below are the ones I would put on a single page for any agent running in an Alberta business, from a dispatch agent in Nisku to an intake agent at a Calgary law firm.
Which AI agent metrics actually matter?
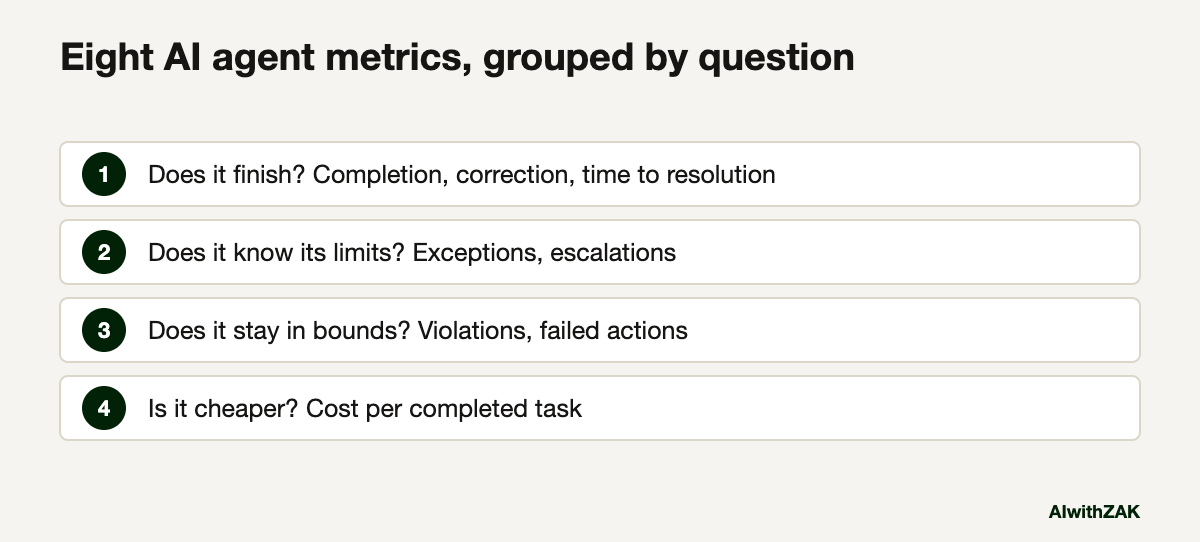
Eight AI agent metrics cover almost every case: task completion rate, human correction rate, exception rate, escalation rate, failed actions, permission violations, cost per completed task and time to resolution. They answer three questions: does it finish the work, does it stay inside its limits, is it cheaper.
The thresholds in the last column are my starting points for when to look closer. I am not aware of a published benchmark that fits a 40-person Alberta company running one or two agents, so treat these as a place to begin and adjust them to your own baseline after a month.
| Metric | What it counts | How to get the number | Starting point to investigate |
|---|---|---|---|
| Task completion rate | Tasks the agent finished end to end, divided by tasks it started | Agent logs or platform analytics | Below 85% on a narrow, well-defined task |
| Human correction rate | Completed tasks a person later edited, reversed or redid | Weekly sample of 20 completed tasks, checked by the person who owns the process | Above 10% after the first month |
| Exception rate | Tasks the agent could not classify or had no rule for | Logs, plus a tag on anything routed to an “other” queue | Rising three weeks in a row |
| Escalation rate | Tasks the agent handed to a person on purpose | Platform analytics or the hand-off queue | Any sharp change, up or down, from the prior month |
| Failed actions | Attempts to write, send, book or update that errored out | Error logs from the agent and the connected systems | Any failed write action not caught and retried |
| Permission violations | Attempts to act outside what the agent is allowed to do | Access logs and blocked-action records | One. Pause and review. |
| Cost per completed task | All costs divided by tasks completed without correction | Invoices, usage reports and review time | Above what the task cost done by a person |
| Time to resolution | Start to finish for a task, including any human steps | Timestamps in logs or your ticketing system | No faster than the baseline you recorded before the agent |
Escalation is the one people misread. A low escalation rate looks good on a dashboard, but an agent that never hands anything to a person is usually guessing on the hard cases. A sudden drop deserves as much attention as a sudden rise.
The diagram below groups the eight by the question each one answers.
Vendors report some of these for you. Microsoft’s guidance for measuring agent performance in Copilot Studio recommends tracking resolution rate, deflection rate, engagement rate and topics with low resolution, and reviewing them monthly. Useful. Those numbers describe how conversations ended, though, and none of them tells you if a person had to fix the result afterwards.
Why is completion rate alone misleading?
Because an agent can complete a task wrongly. Completion rate counts what the agent marked as done, not what was right. The human correction rate, measured by sampling finished work each week, is the number that shows if the agent is saving time or creating hidden rework for your team.
If I could only track one metric, it would be the correction rate. It is also the one no platform reports for you, because the correction happens outside the agent: in the accounting system, in a reply email, in a phone call to smooth something over.
Illustrative example, not a client case study. Picture an oilfield services company in Nisku with an agent that reads field tickets and drafts invoices. The dashboard shows 96% completion. The office lead pulls 20 finished invoices on Friday and finds four where the agent billed standby hours at the wrong rate. That is a 20% correction rate hiding behind a 96% completion rate, and every one of those four would have reached a customer.
The sample takes about half an hour. Nobody enjoys it. It is still the cheapest insurance you will buy for an agent.
What counts as a permission violation, and why is one too many?
A permission violation is any attempt by the agent to act outside what it was allowed: reading data it shouldn’t, sending to someone it shouldn’t, or acting without a required approval. One violation means the limits failed or were never set, so pause the agent and review.
This is the metric where a threshold of zero is the right one. The security group OWASP lists “excessive agency” among its top risks for large language model applications, describing it as the vulnerability that lets damaging actions happen in response to unexpected, ambiguous or manipulated model outputs. Its root causes are excessive functionality, excessive permissions and excessive autonomy. Its mitigations include logging and monitoring what the agent does, and requiring a person to approve high-impact actions before they are taken.
You can only count violations if you set rules first. The always do, ask first, never do rules for AI agent permissions are the place to start. Once they exist, a blocked attempt shows up in logs and becomes countable. Without them, the agent is technically never out of bounds, which is worse.
A blocked attempt still counts. It means the guardrail worked this time, and it tells you the agent tried.
How do you calculate cost per completed task?
Add everything the agent costs in a period, including platform fees, usage charges, support and the time people spend reviewing and fixing its work. Divide by the tasks it completed that nobody had to correct. Compare that number with what the same task cost when a person did it.
Most owners count the subscription and stop. The review time is the part that decides the answer.
Illustrative example, not a client case study. These figures are invented to show the arithmetic. Say an intake agent at a Calgary firm costs $600 a month in platform and usage fees. Staff spend eight hours a month reviewing and fixing its work at a loaded cost of $55 an hour, which is $440. Total: $1,040. It completed 400 intakes, 360 of them without correction. Cost per completed task is $1,040 divided by 360, or about $2.89. If a person used to take 12 minutes per intake at the same $55 an hour, that was $11 a task. The agent wins clearly. If the correction rate climbed to 40%, the review hours would climb with it and the gap would narrow fast.
The full picture, including set-up and the costs that only show up in year two, is in what an AI tool really costs after the licence. To turn the result into a return figure for the owner or the bank, use the method for measuring AI ROI in a small business or the use case ROI calculation.
How should you review AI agent metrics each week?
Thirty minutes, same time every week, with the process owner and the person who runs the agent. Check the eight numbers, read the failed actions and a handful of escalations, sample 20 completed tasks for corrections, and decide one change. Weekly for 90 days, then monthly.
Microsoft suggests a monthly rhythm for its KPIs. For a mature agent, fine. For a new one, I think monthly is too slow: four weeks of a wrong rate or a bad rule is four weeks of customers receiving it.
A routine that fits a Friday afternoon:
- 1. Numbers first. Pull the eight metrics for the week next to the previous four weeks. Five minutes.
- 2. Read every permission violation and failed write action. There should be few. Each gets a cause and an owner.
- 3. Sample 20 completed tasks. The process owner marks each one correct, corrected or wrong. That gives you the correction rate.
- 4. Read five escalations. Were they the right calls? Could a rule have handled any of them?
- 5. Decide one change. One prompt edit, one new rule, one permission tightened, or one task type handed back to people. Write it down with the date.
- 6. Decide on scope. Keep, expand, or pull back. An agent that has held its numbers for a month earns a slightly wider job. One that hasn’t does not.
Paste this into your AI. Export a week of your agent’s task log as a spreadsheet, remove anything containing personal information your policy doesn’t allow in that tool, and paste this with it.
Attached is one week of task logs from an AI agent that [describe the job, e.g. drafts invoices from field tickets]. Each row is one task.

1. Calculate: task completion rate, exception rate, escalation rate, and count of failed actions. Show your working.
2. List any row where the agent attempted something outside these permissions: [paste your always do / ask first / never do rules].
3. Group the failed and escalated tasks by likely cause.
4. Pick 20 completed tasks at random and list them so a person can check them for corrections.
5. Suggest the single change most likely to reduce corrections next week, and say what evidence in the log supports it.
If a column needed for a calculation is missing, say so instead of estimating.
The same routine works for measuring anything you roll out. The broader version, for tools rather than agents, is in how to measure an AI rollout, and the reasons agents stall between pilot and production are covered in why AI pilots fail.
Start the correction-rate sample this Friday, before you look at any dashboard. It is the number that tells you if the agent is doing the work or handing it back to your team.
Questions people ask
Track task completion rate, human correction rate, exception rate, escalation rate, failed actions, permission violations, cost per completed task and time to resolution. Together they show if the agent finishes its work, stays inside its limits and costs less than the old way. The correction rate needs a manual weekly sample because platforms rarely report it.
There is no published benchmark that fits every business. As a starting point, investigate if a narrow, well-defined task falls below about 85% completion. Completion alone can mislead, though, because an agent can finish a task wrongly. Pair it with a human correction rate from a weekly sample of completed work.
Sample completed work. Each week, have the person who owns the process check 20 tasks the agent marked as done and record each as correct, corrected or wrong. The share that needed correcting is your human correction rate, which is the most honest accuracy measure for an agent working in real business systems.
Weekly for the first 90 days, in a 30-minute review with the process owner and the person who runs the agent. Once the numbers hold steady, monthly is reasonable, which matches the cadence Microsoft suggests for Copilot Studio KPIs. Review immediately after any permission violation or a spike in failed actions.
Add platform fees, usage charges, support and the paid time staff spend reviewing and fixing the agent’s work over a period. Divide by the tasks the agent completed without needing correction. Compare the result with the cost of a person doing the same task, using their loaded hourly cost and the time the task used to take.
Pause it after any permission violation until you know the cause. Consider pulling it back if its correction rate stays high after several weekly fixes, if its cost per completed task exceeds the cost of a person doing the work, or if failed actions keep reaching customers. Handing a task type back to people is a legitimate result.